Operations Dashboard
Version: 1.0
Audience: Operations, Supply Chain, Business, and City Teams
Purpose: To help internal users understand how to use the Operations → Dashboard page for daily business tracking.
🌟 Overview
The Dashboard is the first subsection under the Operations section in the Biddano internal system. It provides a daily operational overview, displaying the performance of orders, suppliers, and the overall supply chain through key metrics and visual charts. It is primarily used by operations executives, supply coordinators, and business analysts to monitor daily performance and identify bottlenecks in the supply chain.
🧭 How to Access the Dashboard
- Log in to the Biddano internal system.
- On the left-side navigation panel, click Operations.
- Under Operations, select Dashboard (the first subsection).
- You will see an overview of all order and business statistics for the selected day and supplier.
🗂️ Purpose of the Dashboard
The Dashboard provides a real-time summary of:
- Daily order performance: Total, pending, synced, and cancelled orders.
- Business value generated: Gross Merchandise Value (GMV).
- Supplier-wise and date-wise activity.
- Weekly GMV trends.
This helps operations and business teams make data-backed decisions quickly without relying on detailed reports.
🧱 Dashboard Structure
The Dashboard is divided into three main visual areas:
| Section | Purpose | Example Insights |
|---|---|---|
| Summary Cards | High-level KPIs like GMV, Total Orders, etc. | Quick daily snapshot |
| Charts and Graphs | Visual breakdown of GMV and Order Status | Identify trends or delays |
| Weekly Trend | Weekly GMV visualization | Track consistency and peaks |
📊 1️⃣ Summary Cards Section
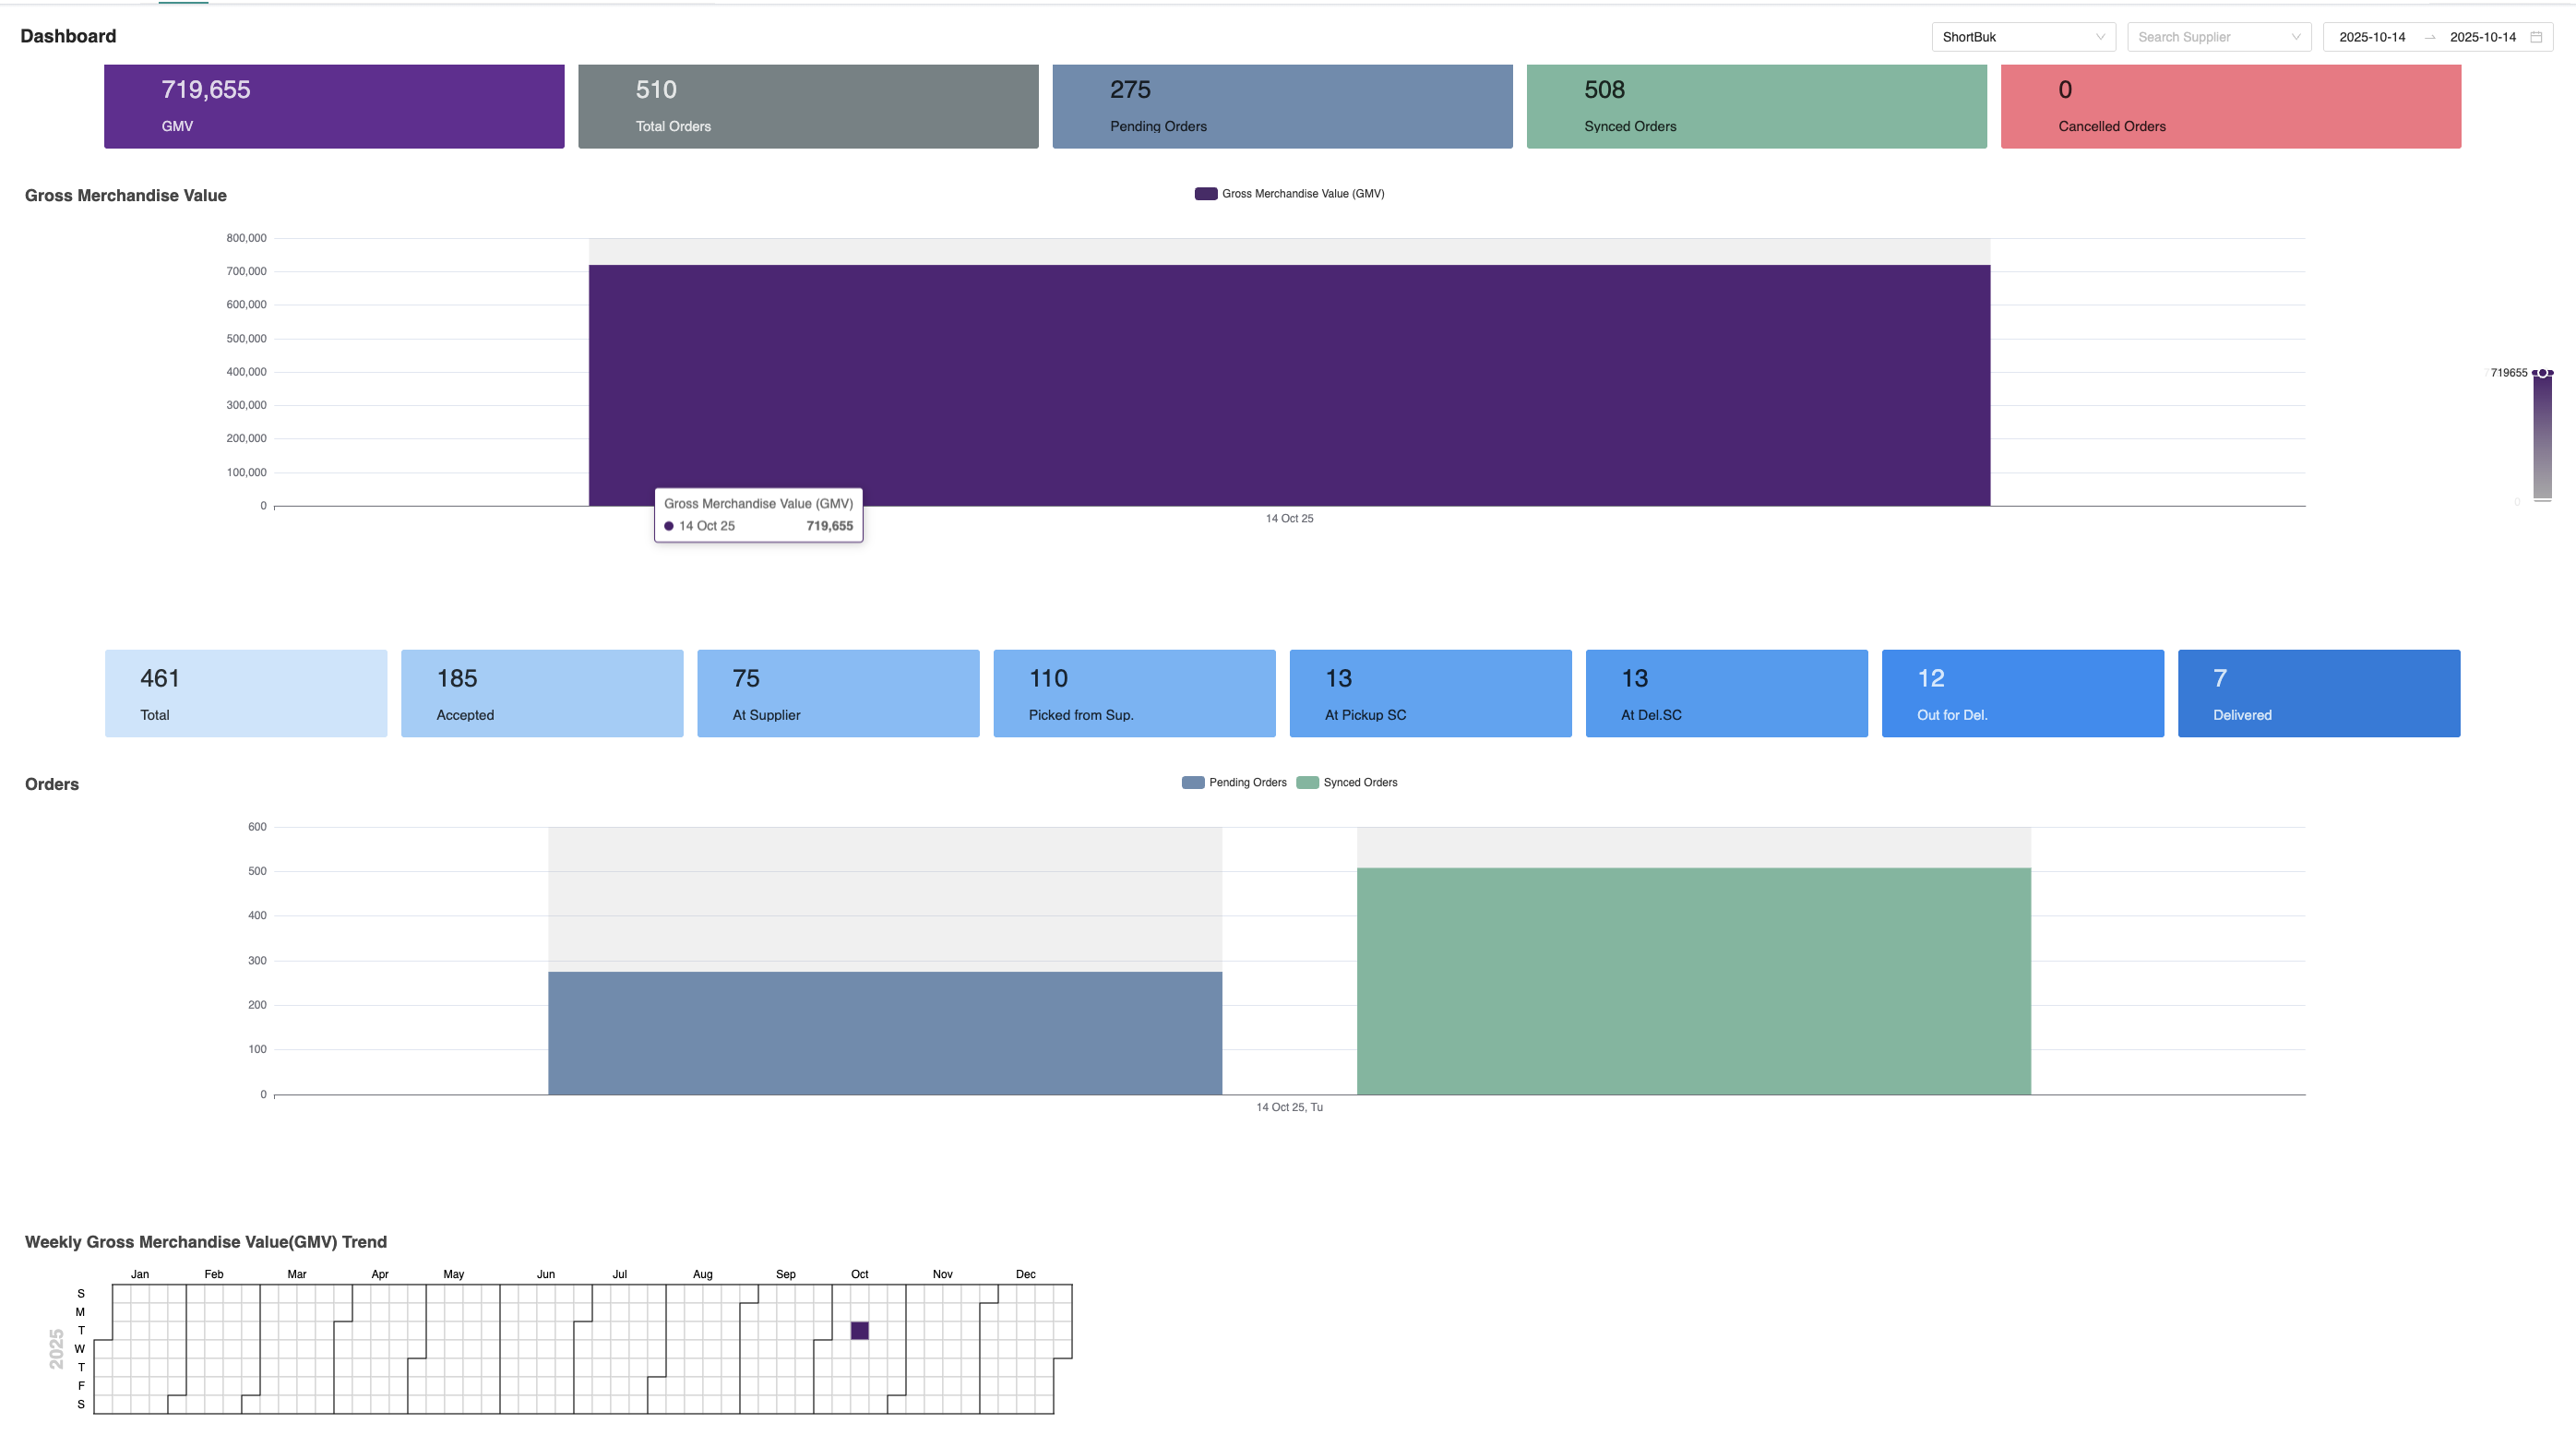
At the top of the page, five colored summary cards display key statistics for the selected supplier and date:
| Card | Description |
|---|---|
| 💜 GMV | Total value of orders placed on that day. |
| ⚙️ Total Orders | Number of total orders received. |
| 🕓 Pending Orders | Orders not yet synced or processed. |
| ✅ Synced Orders | Orders successfully synced with supplier systems. |
| ❌ Cancelled Orders | Orders cancelled by supplier or buyer. |
📌 These values update dynamically based on supplier and date filters.
🔍 2️⃣ Filters and Customization
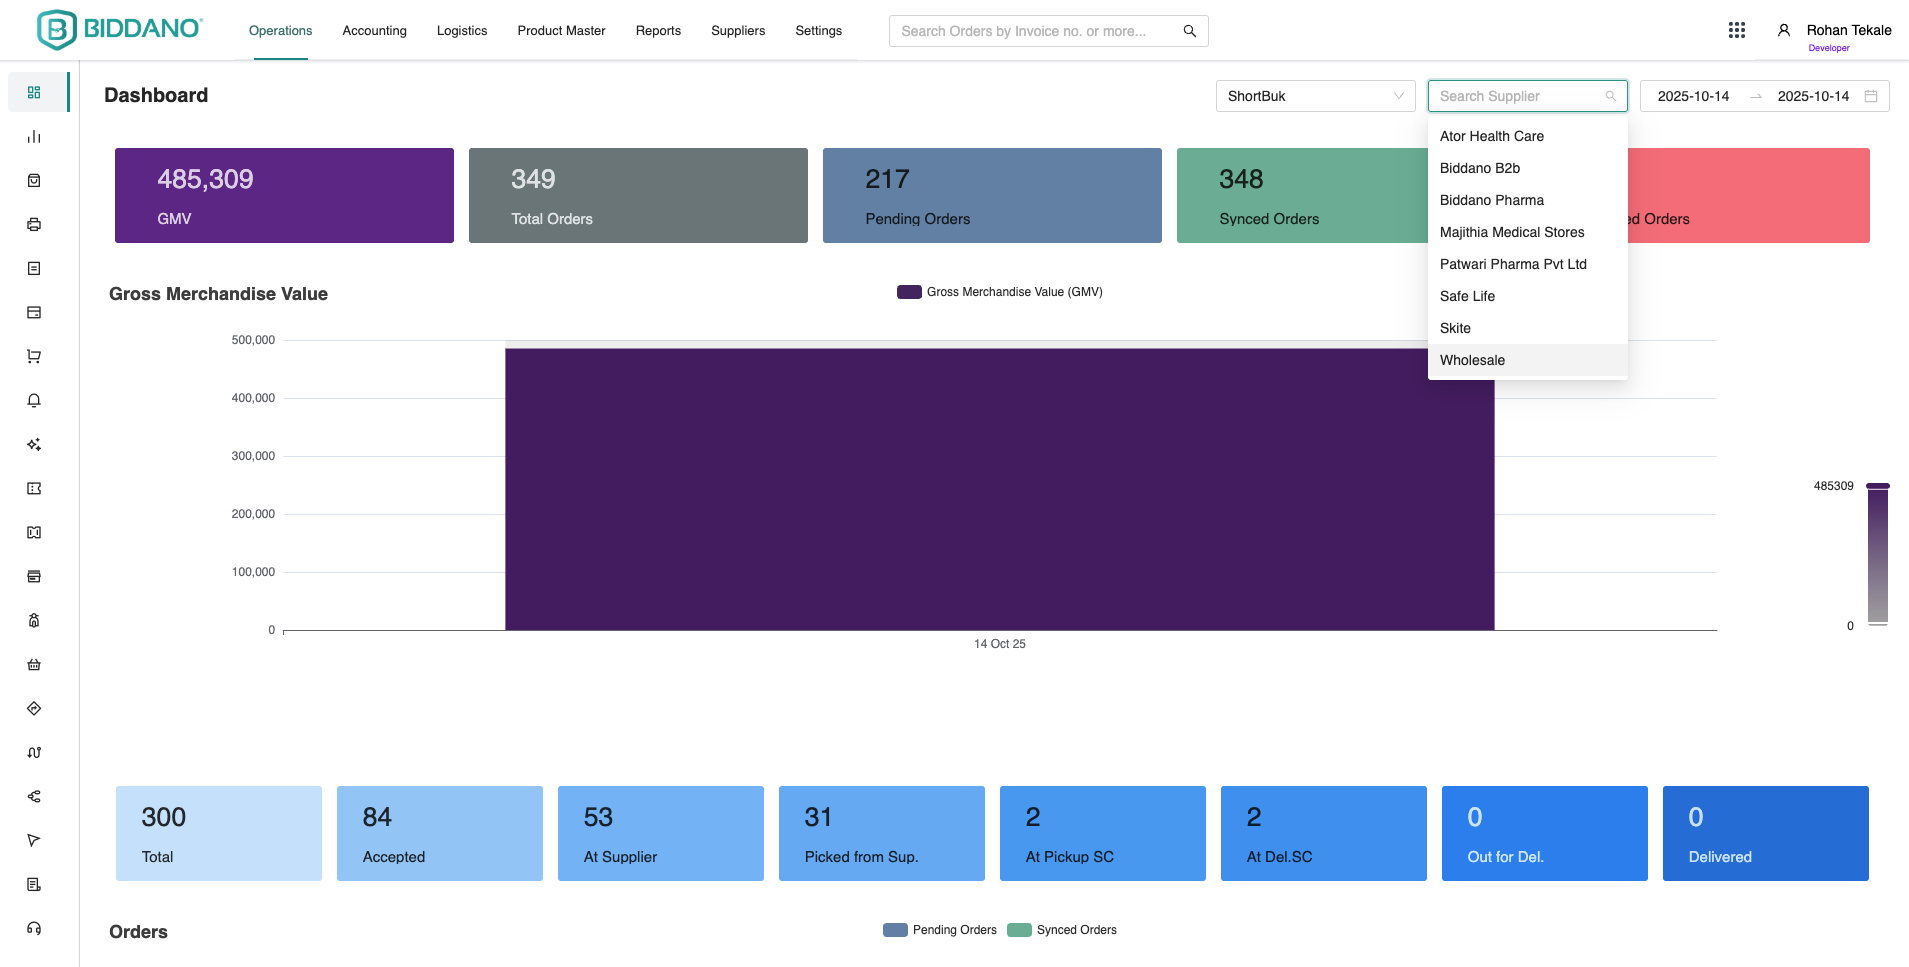
Above the charts, filters allow you to adjust the displayed data:
- Supplier Filter: Choose a specific supplier or keep “All” for combined data.
- Date Filter: Select a single date or range for historical data.
Example: Selecting “ShortBuk” and “2025-10-14” shows stats only for ShortBuk on that day.
📈 3️⃣ Gross Merchandise Value (GMV) Chart
This bar graph visualizes daily GMV (sales value).
Purpose:
- Shows the total value of goods moved each day.
- Helps the business team analyze sales performance.
- Identifies daily fluctuations or unusual drops/spikes.
Tip: Hover over any bar to see the exact GMV amount.
📦 4️⃣ Daily Orders Status
Below the GMV chart, detailed order status cards include:
| Status | Meaning |
|---|---|
| Total | Total orders received on that date. |
| Accepted | Orders accepted by supplier. |
| At Supplier | Orders waiting at supplier. |
| Picked from Supplier | Orders collected and in transit. |
| At Pickup SC | Orders reached the short center. |
| At Del. SC | Orders reached delivery short center. |
| Out for Delivery | Orders assigned for last-mile delivery. |
| Delivered | Orders successfully delivered. |
🟢 Higher synced orders indicate smoother operations.
📅 5️⃣ Weekly GMV Trend
At the bottom, the Weekly Gross Merchandise Value (GMV) Trend shows weekly sales performance in a calendar-like view.
Purpose:
- Tracks GMV changes week over week.
- Identifies the most and least active business weeks.
- Useful for monthly or weekly performance reviews.
Note: Dark-colored boxes indicate higher GMV; lighter boxes indicate lower GMV.
🧠 How Operations Teams Use It
| Use Case | Who Uses It | Purpose |
|---|---|---|
| Daily Ops Review | City Operations Lead | Review total and pending orders. |
| Supplier Monitoring | SCM Team | Check suppliers with order delays. |
| Performance Tracking | Business Team | Analyze GMV growth over time. |
| Morning Huddle | All Ops Members | Align on daily targets. |
⚡ Common Scenarios
- Morning Review: Operations Executive checks total orders, GMV, and supplier performance before the first supply run.
- Supplier Delay: High pending orders prompt the user to apply a supplier filter to identify the cause.
- Weekly Trend Analysis: City Head uses the GMV trend chart to compare week-on-week performance and identify improvement areas.
💬 Quick Tips for Users
- Always set the correct date range before reviewing numbers.
- Use the supplier filter to troubleshoot specific performance issues.
- Refresh data before morning and evening huddles.
- Use graphs for quick visual comparisons rather than raw numbers.
- If data looks off, confirm with BI or Tech team before escalating.
Pro Tip: Bookmark the Dashboard for quick access during daily huddles!
🧾 Summary
| Feature | Description |
|---|---|
| Module Location | Operations → Dashboard (first subsection) |
| Main Purpose | Monitor daily order flow and GMV performance |
| Data Filters | Supplier-wise and date-wise |
| Key Charts | GMV chart, Order Status chart, Weekly Trend |
| Users | Operations Executives, City Leads, SCM, Business Analysts |
🧰 Support & Troubleshooting
| Issue | Possible Cause | Action |
|---|---|---|
| Data not showing | Filter not applied correctly | Refresh and reapply filters |
| Wrong GMV total | Sync delay from supplier | Wait 15–20 mins and retry |
| Supplier missing | Supplier not active | Report to Admin or DevOps |
| Chart not loading | Browser cache issue | Clear cache or reload page |
🏁 Conclusion
The Operations → Dashboard is your one-stop visual summary for all daily supply chain and order management activities. It helps track real-time performance, identify pending bottlenecks, and review GMV trends effortlessly. By checking this page daily, operations teams can ensure smoother coordination, timely supplier follow-ups, and improved overall efficiency.